
Disclaimer:
The authors are solely responsible for the content of this report. Material included herein does not represent the opinion of the European Community, and the European Community is not responsible for any use that might be made of it.
Back to overview measures
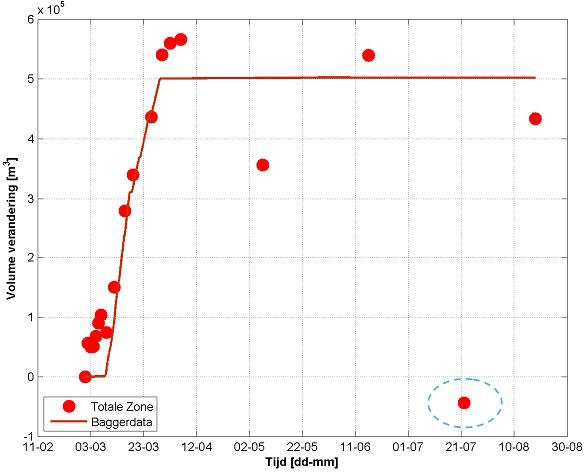
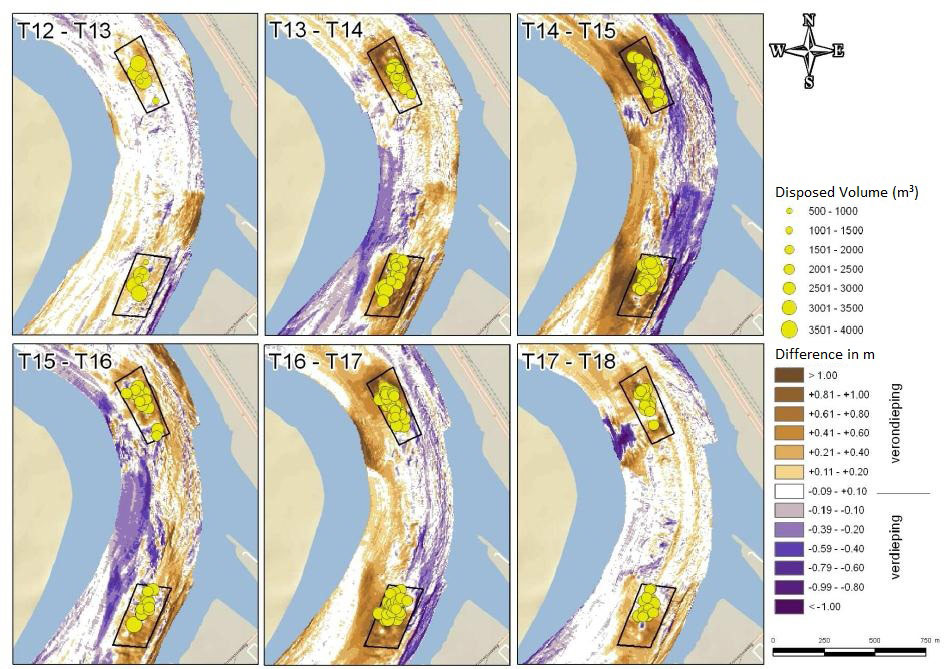
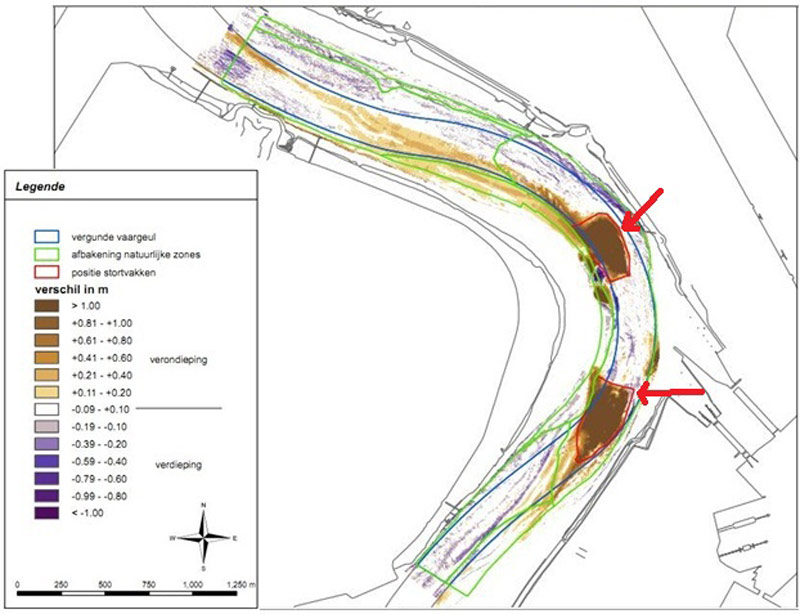
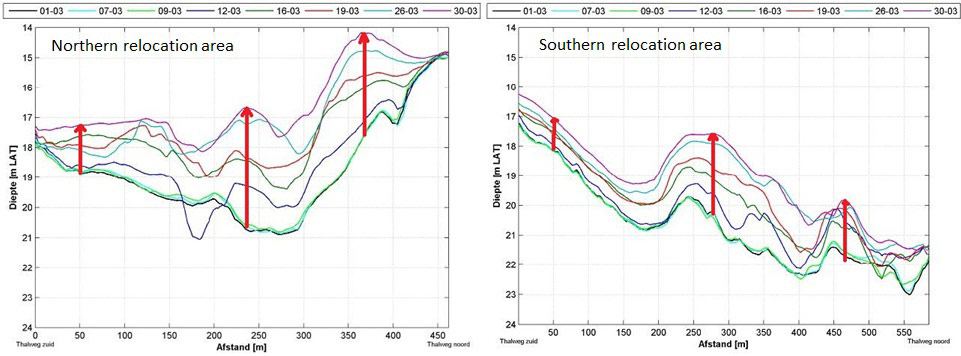
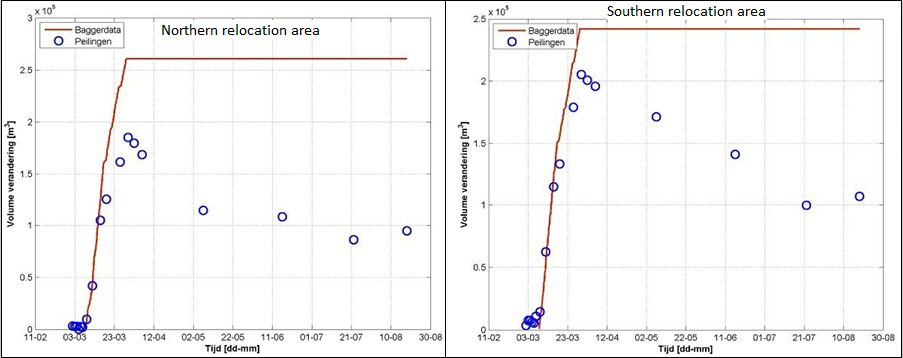
Secondly, the morphological changes during the execution of the relocation test (during three weeks) were analysed. During the relocation (Figure 4), the deep areas of the fairway near Ketelplaat elevated with 1 m (brown area on Figure 5). At the transects through both relocation areas, the changes in bathymetry under influence of the relocation activities are visible: elevation/sedimentation (Figure 6). However, immediately after relocation 20% to 30% of the relocated material had already disappeared out of the relocation site into the immediate surrounding of the relocation site. The downward volume change is also clearly recognizable on Figure 7. The disappeared material is mainly found in the ‘Puttenzone’, the ‘Ketelplaat’ and at the ‘Drempel van Lillo’.
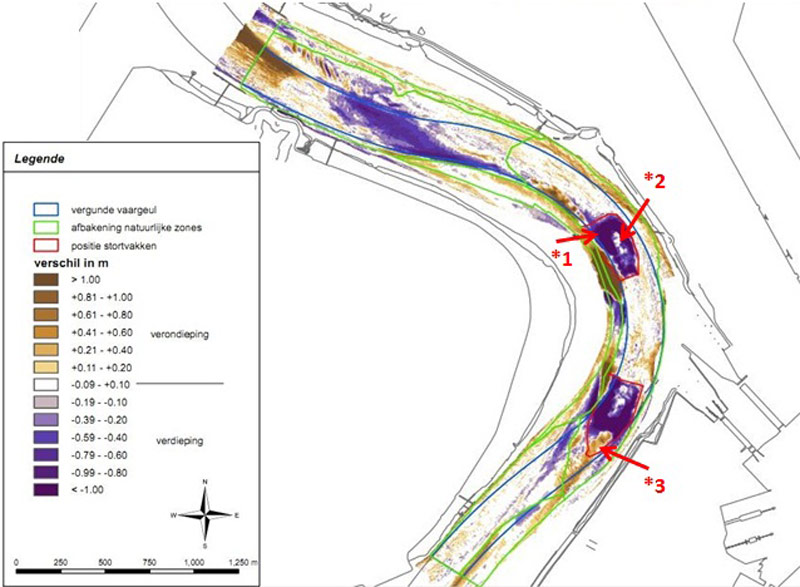
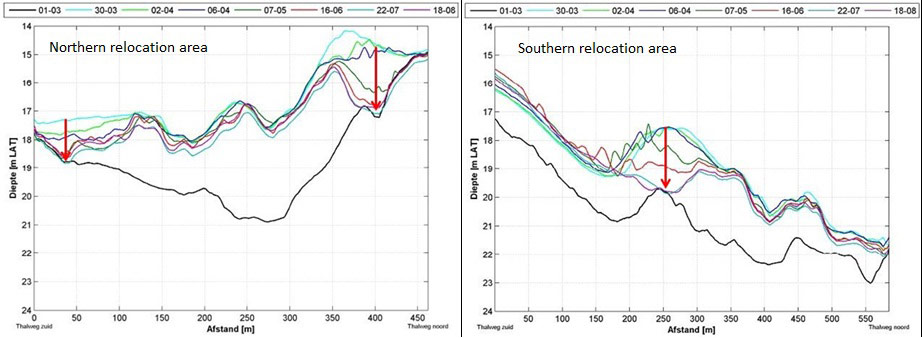
Lastly, also the morphological changes after the relocation test (March-August 2010) were analysed. Four to five months after the relocation test, the relocation areas in the navigation channel (near Ketelplaat) were eroded again at most spots (Figure 8), but this stagnated really quickly (Figure 9). Mainly at the edge it deepened again to the original depth (dark blue on Figure 8: *1). Only at some spots, the relocated material was stable four to five months after the relocation test (35% to 40% of the total relocated material) (white on Figure 8: *2). At one edge of the southern site even sedimentation took place and caused elevation (brown on Figure 8: *3). The different trends within both relocation areas are showed by the longitudinal profiles on Figure 10. In general, a large amount of the relocated material disappeared out of the deep relocation areas after the execution of the relocation test. A large amount of this sediment was accumulated at the Ketelplaat and hence did not disappear out of the study area.
In both relocation areas, the bathymetry after the relocation test had flattened. The averaged erosion was 0.8 m for the northern relocation site and 0.9 m for the southern relocation site.
Back to top
TIDE pilot project 2: Navigation channel near Ketelplaat – Relocation of dredged sediment to deep areas of the navigation channel
Table of content
- 1. Description of measure
- 1a. Measure description
- 1b. Monitoring
- 1c. Monitoring results
- 2. Execution of main effectiveness criteria
- 2a. Effectiveness according to development targets of measure
- 2b. Impact on ecosystem services
- 2c. Degree of synergistic effects and conflicts according to uses
- 3. Additional evaluation criteria in view of EU environmental law
- 3a. Degree of synergistic effects and conflicts according to WFD aims
- 3b. Degree of synergistic effects and conflicts according to Natura 2000 aims
- 4. Crux of the matter
- 5. References
Additional information
for this measure:
No further information available.
for this measure:
No further information available.
Monitoring results
First, the long term (1996-2010) and short term (March 1-7 2010) natural evolution of erosion and sedimentation in the study area were analysed. The long term analysis shows a general trend for deepening of the area. This is probably not completely due to natural processes, because many dredging activities occurred at a regular basis in this area between 1996 and 2010. The short period just before the relocation test shows however a sedimentation.Secondly, the morphological changes during the execution of the relocation test (during three weeks) were analysed. During the relocation (Figure 4), the deep areas of the fairway near Ketelplaat elevated with 1 m (brown area on Figure 5). At the transects through both relocation areas, the changes in bathymetry under influence of the relocation activities are visible: elevation/sedimentation (Figure 6). However, immediately after relocation 20% to 30% of the relocated material had already disappeared out of the relocation site into the immediate surrounding of the relocation site. The downward volume change is also clearly recognizable on Figure 7. The disappeared material is mainly found in the ‘Puttenzone’, the ‘Ketelplaat’ and at the ‘Drempel van Lillo’.
Lastly, also the morphological changes after the relocation test (March-August 2010) were analysed. Four to five months after the relocation test, the relocation areas in the navigation channel (near Ketelplaat) were eroded again at most spots (Figure 8), but this stagnated really quickly (Figure 9). Mainly at the edge it deepened again to the original depth (dark blue on Figure 8: *1). Only at some spots, the relocated material was stable four to five months after the relocation test (35% to 40% of the total relocated material) (white on Figure 8: *2). At one edge of the southern site even sedimentation took place and caused elevation (brown on Figure 8: *3). The different trends within both relocation areas are showed by the longitudinal profiles on Figure 10. In general, a large amount of the relocated material disappeared out of the deep relocation areas after the execution of the relocation test. A large amount of this sediment was accumulated at the Ketelplaat and hence did not disappear out of the study area.
In both relocation areas, the bathymetry after the relocation test had flattened. The averaged erosion was 0.8 m for the northern relocation site and 0.9 m for the southern relocation site.