

Disclaimer:
The authors are solely responsible for the content of this report. Material included herein does not represent the opinion of the European Community, and the European Community is not responsible for any use that might be made of it.
Back to overview reports
The largest tidal amplitude is observed within the Scheldt oligohaline zone (5.5 ± 0.1 m). Next, the Humber has the largest tidal amplitude with its maximum in the mesohaline zone (4.4 ± 0.2 m). The maximum tidal amplitudes within the Elbe and Weser are for both estuaries found within the freshwater zone (table 3; 3.6 ± 0.04 m and 3.8 ± 0.1 m, respectively).
Channel width (W)
Width for all estuaries increases from the freshwater to the polyhaline zone. The Scheldt and Humber are both the more narrow estuaries, while the Elbe is the widest estuary (table 3).
Wet cross-section (A)
Cross-section follows the same trend as channel width and gradually increases towards the polyhaline zone (table 3). The Elbe clearly has the highest cross section. The Scheldt, Humber and Weser all have similar cross-sections. The larger width of within the Weser indicates that this is a more shallow estuarine system.
Averaged depth (D) & bathymetrical depth (D bath)
In general bathymetrical depth increases towards the sea in all estuaries (fig. 11). The Elbe is clearly the deepest estuary along the whole estuarine gradient, while the Humber and Scheldt are shallower. In the Elbe and Weser depth increases gradually, except for the freshwater zone 3 within the Elbe. In the Humber and Scheldt depth increases more abruptly from the oligohaline zone towards the meso- and polyhaline zone.
When average depth is considered, in which cross-section and width are taken into account, it is clear that despite the Weser being deeper, in fact the Scheldt is less wide and thus can be considered as the ‘deeper’ estuarine system from an ecological point of view from the oligohaline towards the polyhaline zone (fig. 11).
Table 3 Summary statistics of geometry data per estuary. TA = tidal amplitude, W = tidal channel width, A = wet cross-section, D = averaged depth: cross-section/width, D bath = bathymetrical depth
Back to top
How do TIDE estuaries function as a filter for nutrients?
What are the important factors controlling ecosystem functioning?
What is important in establishing a zonation for estuaries?
What parameters should be used to define and evaluate measure targets?
Which measures are suitable to improve the physical characteristics and chemical water quality?
Which variables limit estuarine primary production?
An interestuarine comparison for ecology in TIDE
Table of content
- 1. Introduction
- 1a. Biogeochemical processing for N, P and Si in Northern temperate estuaries
- 1b. Nutrient fluxes
- 1c. Primary production
- 1d. Differences and similarities between Elbe, Scheldt, Humber and Weser
- 2. Material and methods
- 2a. Study area & period
- 2b. Physics
- 2c. Biogeochemistry
- 3. Results
- 3a. Physics 2
- 3b. Biogeochemistry 2
- 4. Discussion
- 4a. Estuarine patterns
- 4b. Different sink and source functions for nutrients
- 4c. Oxygen deficiencies
- 4d. Primary production 2
- 5. Conclusion
- 5a. What are the important factors controlling ecosystem functioning within the TIDE estuaries?
- 5b. How do TIDE estuaries function as a filter for nutrients?
- 5c. How can we avoid oxygen deficiency situations in the TIDE estuaries?
- 5d. Which variables limit primary production in the TIDE estuaries?
- 5e. Lessons learnt from TIDE: towards ecosystem services and measures, recommendations for further estuarine management
- 6. References
Authors:
by Geerts L, Maris T, Meire P
With contributions of Beauchard O, Schöl A, Vandenbruwaene W., Van Damme S, Wolfstein K, Manson S, Saathoff S, Soetaert K, Cox T, Meire A, (February 2013)
by Geerts L, Maris T, Meire P
With contributions of Beauchard O, Schöl A, Vandenbruwaene W., Van Damme S, Wolfstein K, Manson S, Saathoff S, Soetaert K, Cox T, Meire A, (February 2013)
3a. Physics
Hydrodynamics
Freshwater discharge
As can be observed in fig. 9, the Elbe has clearly the highest freshwater discharge in general, with its maximum in spring 2006 (1 395 m3/s). In the Weser a maximum freshwater discharge of 587 m3/s is observed in winter 2007. Lowest discharges are in general observed within the Scheldt estuary (maximum in winter 2007, 189 m3/s). In the Humber a clear peak can be observed in 2006 of 178 m3/s. Peaks within the Elbe tend to occur in spring. However, in the Scheldt peaks can be observed earlier in winter. It has to be noticed that peaks are less likely to be pronounced, since seasonal averages are displayed. Lowest discharges are observed in summer. Summer discharges seem to differ more strongly in the Elbe estuary, while they stay relatively constant within the Scheldt estuary.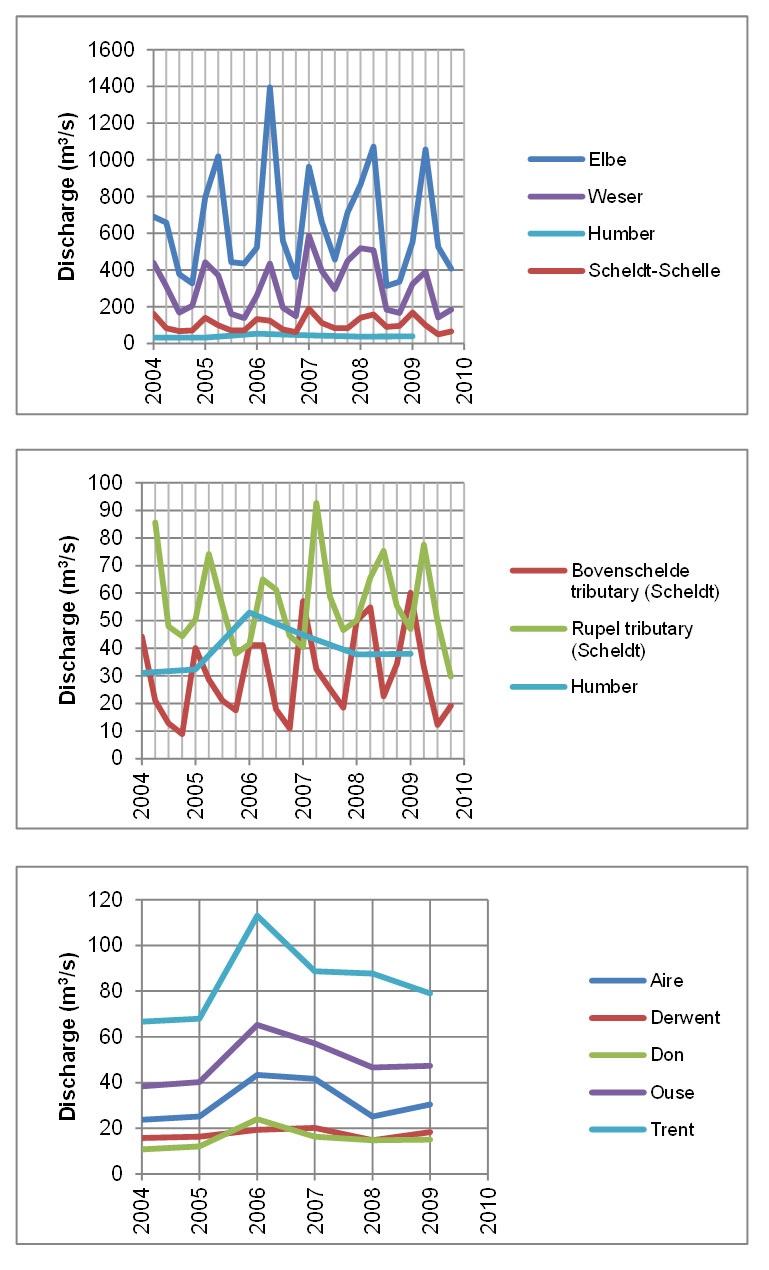
Residence time
In general, the higher residence times are observed in summer for all four estuaries. Remarkable from fig. 10 is the reversed pattern in Elbe and Weser compared to Scheldt and Humber. In Elbe and Weser residence times decrease towards the polyhaline zone, while in Scheldt and Humber residence times rather seem to increase towards the polyhaline zone. Furthermore, the difference between summer and winter residence time decreases towards the polyhaline zone in Elbe and Weser, while in Scheldt and Humber this difference between summer and winter persists. This can in part be explained by the method of calculation (Vandenbruwaene et al. 2012 ). For the Elbe and Weser the limit near the sea is set at 151 and 89 TIDE km respectively, while in fact the polyhaline zone is much larger (but could not be calculated, because of sudden estuarine widening). Hence, residence times (days) are underestimated in the Elbe and Weser estuary. When normalized for the length of each zone (in days/km), we can observe slightly more similar patterns along the estuarine gradient per estuary. Even though we can still see a decrease in residence time towards the sea in the Elbe and Weser, after normalization for length per zone, residence times are higher in the oligo- and mesohaline zone for all estuaries. Taking into account all zones, highest residence times are found in the mid-estuary of the Scheldt. When comparing residence times in the freshwater zone solely, higher values are found in the Elbe estuary, while lower values are observed in the Scheldt estuary.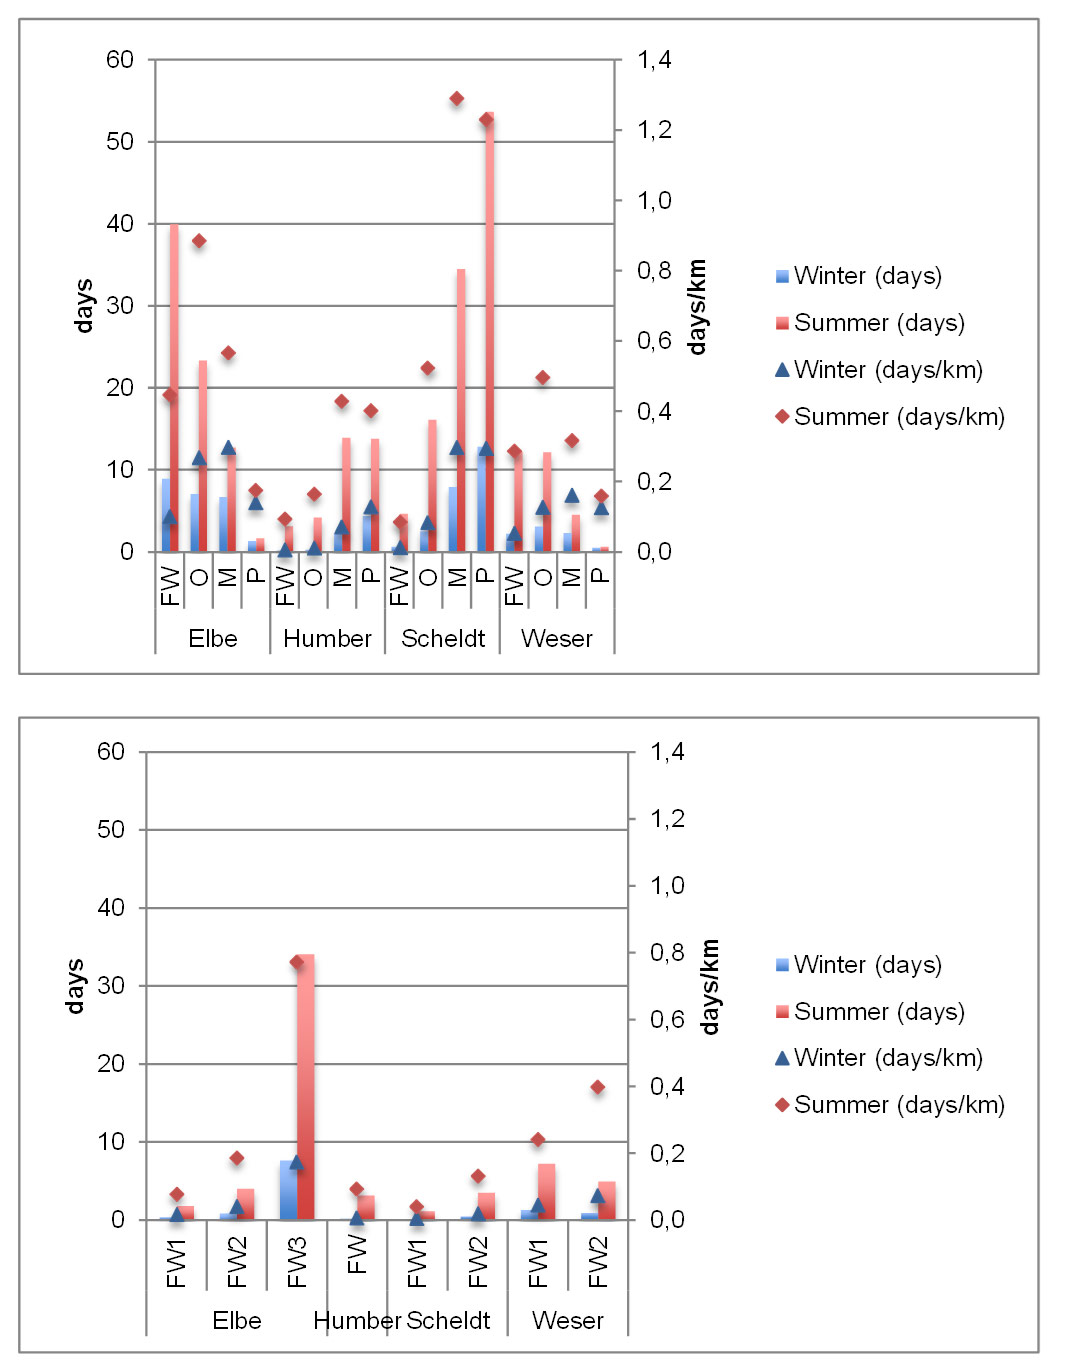
3a. Morphology
Intertidal and subtidal areas
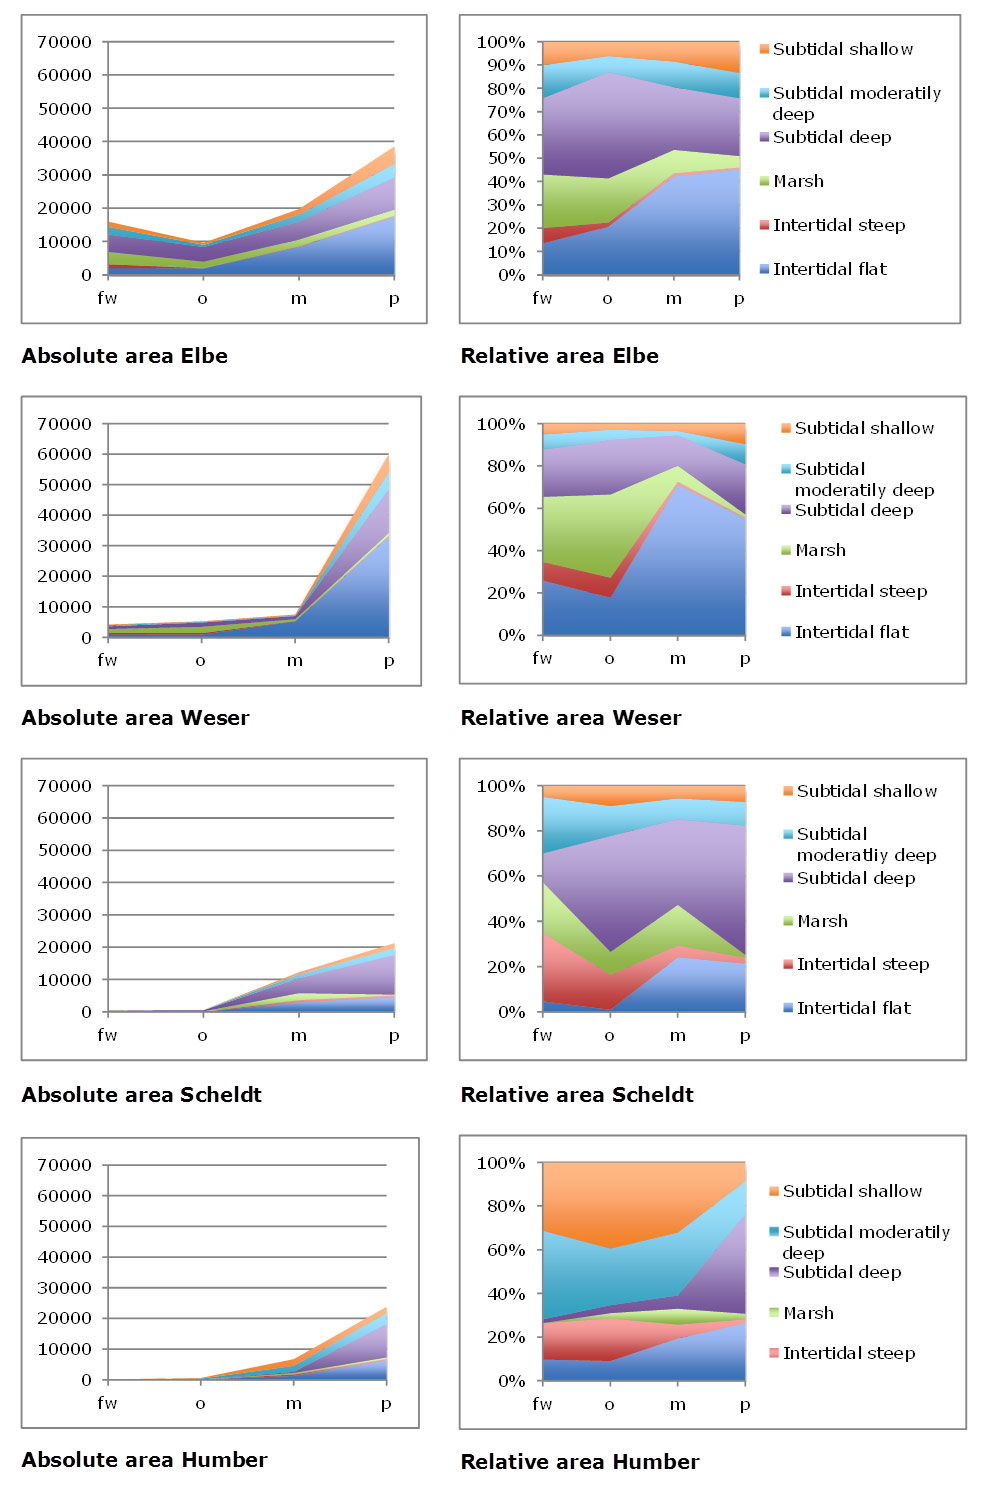
In all estuaries absolute intertidal area, marshes and subtidal area appears to increase in a proportional similar way towards the sea (fig. 12). Only in the Scheldt a decline in intertidal area and marshes from the meso- to polyhaline zone can be observed. The highest increase is usually observed from the oligohaline zone towards the polyhaline zone; however in the Elbe there is also a high amount of intertidal and subtidal area observed within the freshwater zone. Most marsh and intertidal area can be found within the Weser estuary; in all of its zones the relative amount of intertidal flats and marshes is higher than the subtidal area (except for the most upstream freshwater zone). The least amount of intertidal area and marshes can be found within the Humber estuary; however the Humber estuary is also the smallest estuarine area considered (± 31 270 ha). In the Humber there is always relatively more subtidal than intertidal flats and marshes. Nevertheless, this is mostly shallow to moderately deep subtidal area. In fact, the Humber estuary shows relatively the least amount of subtidal deep. Contrarily, the Scheldt comprises relatively the most subtidal deep and intertidal steep in general along the estuarine gradient. Furthermore, the relative least intertidal mudflat can be observed in the freshwater zone of the Scheldt estuary.Geometry
Tidal amplitude (TA)The largest tidal amplitude is observed within the Scheldt oligohaline zone (5.5 ± 0.1 m). Next, the Humber has the largest tidal amplitude with its maximum in the mesohaline zone (4.4 ± 0.2 m). The maximum tidal amplitudes within the Elbe and Weser are for both estuaries found within the freshwater zone (table 3; 3.6 ± 0.04 m and 3.8 ± 0.1 m, respectively).
Channel width (W)
Width for all estuaries increases from the freshwater to the polyhaline zone. The Scheldt and Humber are both the more narrow estuaries, while the Elbe is the widest estuary (table 3).
Wet cross-section (A)
Cross-section follows the same trend as channel width and gradually increases towards the polyhaline zone (table 3). The Elbe clearly has the highest cross section. The Scheldt, Humber and Weser all have similar cross-sections. The larger width of within the Weser indicates that this is a more shallow estuarine system.
Averaged depth (D) & bathymetrical depth (D bath)
In general bathymetrical depth increases towards the sea in all estuaries (fig. 11). The Elbe is clearly the deepest estuary along the whole estuarine gradient, while the Humber and Scheldt are shallower. In the Elbe and Weser depth increases gradually, except for the freshwater zone 3 within the Elbe. In the Humber and Scheldt depth increases more abruptly from the oligohaline zone towards the meso- and polyhaline zone.
When average depth is considered, in which cross-section and width are taken into account, it is clear that despite the Weser being deeper, in fact the Scheldt is less wide and thus can be considered as the ‘deeper’ estuarine system from an ecological point of view from the oligohaline towards the polyhaline zone (fig. 11).
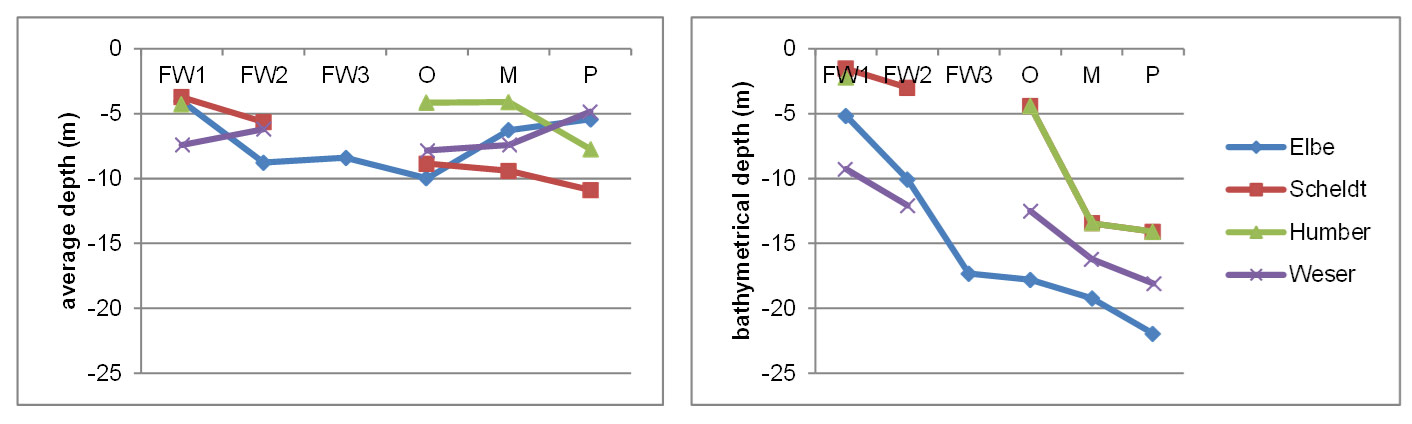
Table 3 Summary statistics of geometry data per estuary. TA = tidal amplitude, W = tidal channel width, A = wet cross-section, D = averaged depth: cross-section/width, D bath = bathymetrical depth
| Scheldt | Elbe | ||||||||||
| Zone | TA | W | A | D | D bath | TA | W | A | D | D bath | |
| FW1 | n | 156 | 145 | 145 | 145 | 151 | 97 | 97 | 97 | 97 | 97 |
| m | 2.7 | 61.7 | 251.9 | -3.7 | -1.5 | 3.4 | 358.3 | 1502.7 | -4.0 | -5.2 | |
| sd | 0.9 | 17.9 | 108.8 | 1.1 | 1.7 | 0.1 | 74.5 | 346.9 | 0.6 | 1.3 | |
| FW2 | n | 135 | 135 | 135 | 135 | 133 | 64 | 64 | 64 | 64 | 62 |
| m | 4.7 | 141.7 | 826.6 | -5.7 | -3.0 | 3.6 | 328.7 | 3311.1 | -8.8 | -10.1 | |
| sd | 0.6 | 59.3 | 351.2 | 0.9 | 2.1 | 0.0 | 134.8 | 2442.0 | 3.6 | 4.9 | |
| FW3 | n | 72 | 72 | 72 | 72 | 74 | |||||
| m | 3.07 | 1962.86 | 16059.15 | -8.41 | -17.33 | ||||||
| sd | 0.20 | 547.28 | 3966.68 | 1.47 | 1.54 | ||||||
| O | n | 113 | 113 | 113 | 113 | 62 | 47 | 47 | 47 | 47 | 47 |
| m | 5.5 | 381.2 | 3499.2 | -8.9 | -4.4 | 2.8 | 2575.0 | 24695.8 | -10.0 | -17.8 | |
| sd | 0.1 | 97.7 | 1318.5 | 2.1 | 2.1 | 0.0 | 665.6 | 2532.8 | 1.5 | 1.9 | |
| M | n | 92 | 92 | 92 | 92 | 51 | 21 | 21 | 21 | 21 | 21 |
| m | 5.2 | 1722.0 | 14481.4 | -9.4 | -13.4 | 2.9 | 7739.6 | 42550.4 | -6.3 | -19.2 | |
| sd | 0.2 | 978.9 | 5800.2 | 1.8 | 3.4 | 0.0 | 3158.1 | 13009.3 | 1.0 | 3.2 | |
| P | n | 144 | 144 | 144 | 144 | 27 | 9 | 9 | 9 | 9 | 9 |
| m | 4.4 | 4759.3 | 52388.8 | -10.9 | -14.1 | 2.9 | 13572.7 | 72213.4 | -5.4 | -22.0 | |
| sd | 0.3 | 1227.7 | 19129.7 | 2.3 | 3.1 | 0.0 | 1733.7 | 15469.3 | 0.4 | 3.9 | |
| Humber | Weser | ||||||||||
| FW1 | n | 167 | 167 | 167 | 167 | 284 | 61 | 61 | 61 | 61 | 61 |
| m | 1.7 | 50.9 | 225.7 | -4.3 | -2.2 | 3.8 | 342.8 | 2670.3 | -7.4 | -9.3 | |
| sd | 0.6 | 15.1 | 108.2 | 1.0 | 2.0 | 0.1 | 96.0 | 1096.5 | 1.9 | 2.5 | |
| FW2 | n | 26 | 26 | 26 | 26 | 26 | |||||
| m | 3.6 | 827.8 | 4297.4 | -6.2 | -12.1 | ||||||
| sd | 0.0 | 311.6 | 671.6 | 1.0 | 0.8 | ||||||
| O | n | 121 | 121 | 121 | 121 | 62 | 50 | 50 | 50 | 50 | 50 |
| m | 3.4 | 168.4 | 691,7 | -4.2 | -4.4 | 3.5 | 1028.2 | 7724.5 | -7.9 | -12.5 | |
| sd | 0.3 | 55.0 | 210.1 | 1.2 | 2.1 | 0.1 | 157.9 | 1408.8 | 1.5 | 1.6 | |
| M | n | 64 | 64 | 64 | 64 | 51 | 27 | 27 | 27 | 27 | 27 |
| m | 4.4 | 1862.7 | 8326.6 | -4.1 | -13.4 | 3.2 | 2969.9 | 15010.1 | -7.4 | -16.2 | |
| sd | 0.2 | 674.5 | 3991.1 | 0.9 | 3.4 | 0.1 | 1816.2 | 5245.6 | 1.7 | 1.8 | |
| P | n | 72 | 72 | 72 | 72 | 27 | 10 | 10 | 10 | 10 | 10 |
| m | 3.6 | 5297.1 | 41030.5 | -7.7 | -14.1 | 3.1 | 8000.6 | 33505.5 | -4.9 | -18.1 | |
| sd | 0.2 | 2589.4 | 19493.6 | 1.2 | 3.1 | 0.0 | 702.8 | 3544.5 | 0.6 | 1.4 | |
Important to know
Reports / Measures / Tools
| Report: | Zonation of the TIDE estuaries (Functioning) |
|---|---|
| Report: | Interestuarine comparison: Hydro-geomorphology (Functioning) |
Management issues
How can we avoid oxygen deficiency situations?How do TIDE estuaries function as a filter for nutrients?
What are the important factors controlling ecosystem functioning?
What is important in establishing a zonation for estuaries?
What parameters should be used to define and evaluate measure targets?
Which measures are suitable to improve the physical characteristics and chemical water quality?
Which variables limit estuarine primary production?